
The Market Update for Q1 2022 is here! Every quarter of the year we compile the data from the following counties: Pierce, Kitsap, Thurston & King. The data is pulled directly from the Northwest Multiple Listing Service. Curious about the stats for your specific neighborhood? Let us know, we are happy to run a market update report tailored just for you.
Median Sales Price January 2022 vs. March 2022 per County
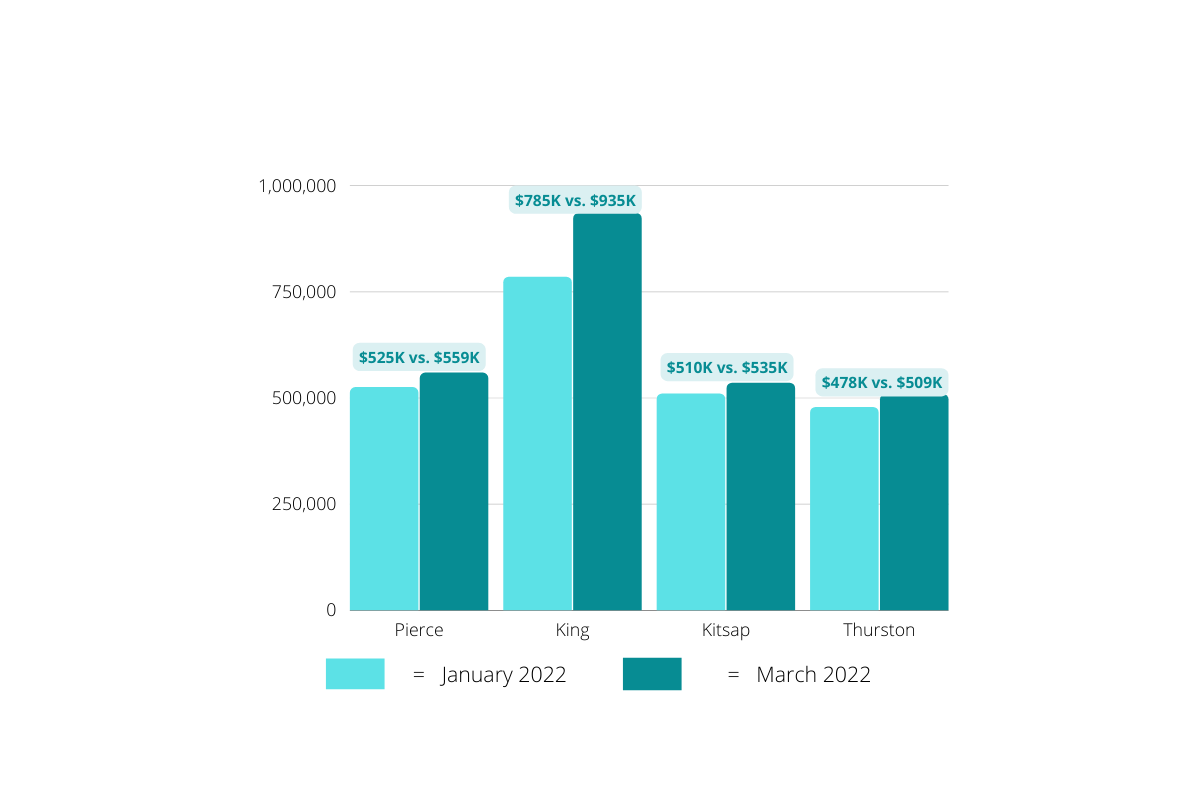
We’ve definitely felt as if the “Spring” real estate market has come early this year! All counties have seen an increase in median sales price throughout the first few months of the year. While an increase in median sales price was to be expected, we’ve been pleasantly surprised by the amount of new inventory that has significantly surged. Above, are the median price for homes that have sold in Pierce, Kitsap, Thurston and King counties. King County has seen the greatest increase for residential homes. Thurston County is now over the $500K threshold and climbing. According to our data, Pierce, Kitsap and Thurston Counties homes sold earn roughly 105% of the listing price. King County homes that sold are at 113% of listing price.
New Listings January 2022 vs. March 2022 per County
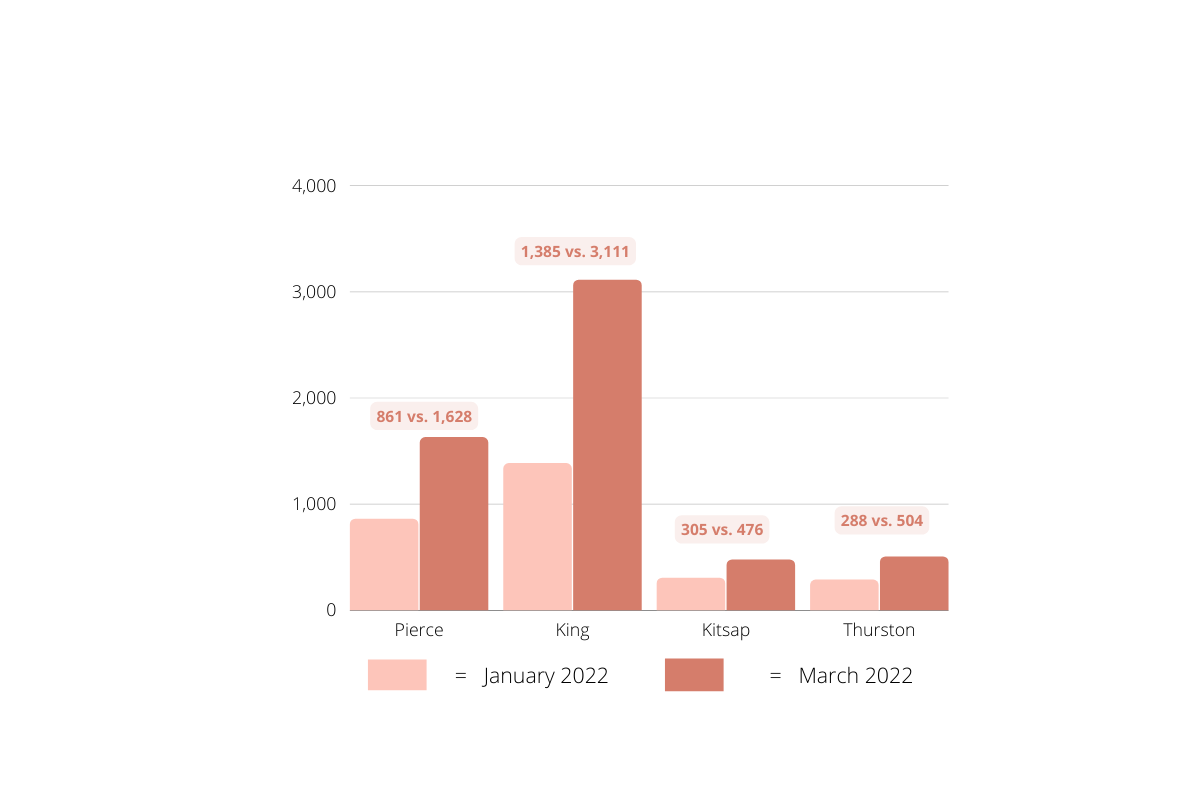
This statistic has been the most interesting to follow (in our opinion). Pierce County inventory has nearly doubled in three short months. King County’s new listings have multiplied (by nearly 2.5) from January to March as well. Kitsap and Thurston have not seen the surge of new inventory quite like Pierce and King, however, we’ll keep you posted as we continue to watch the numbers heading into Q2.
Median Sales Price January 2022 vs. March 2022
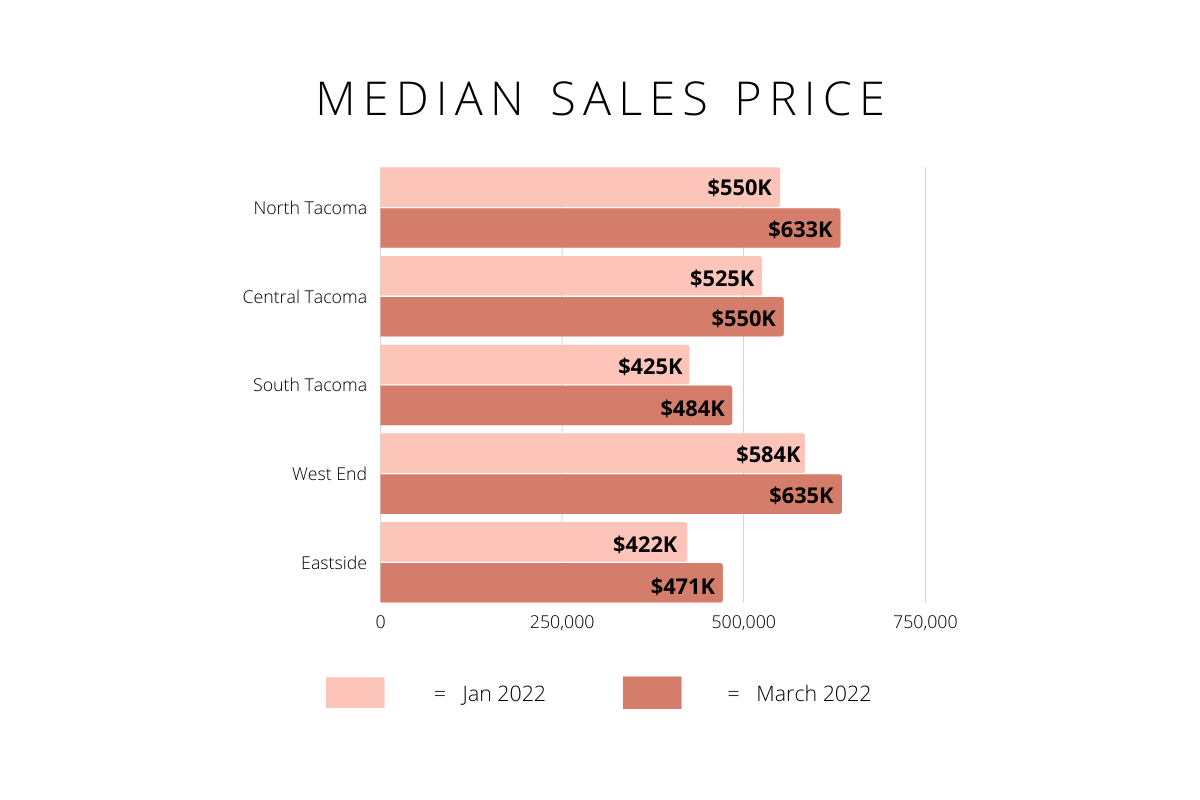
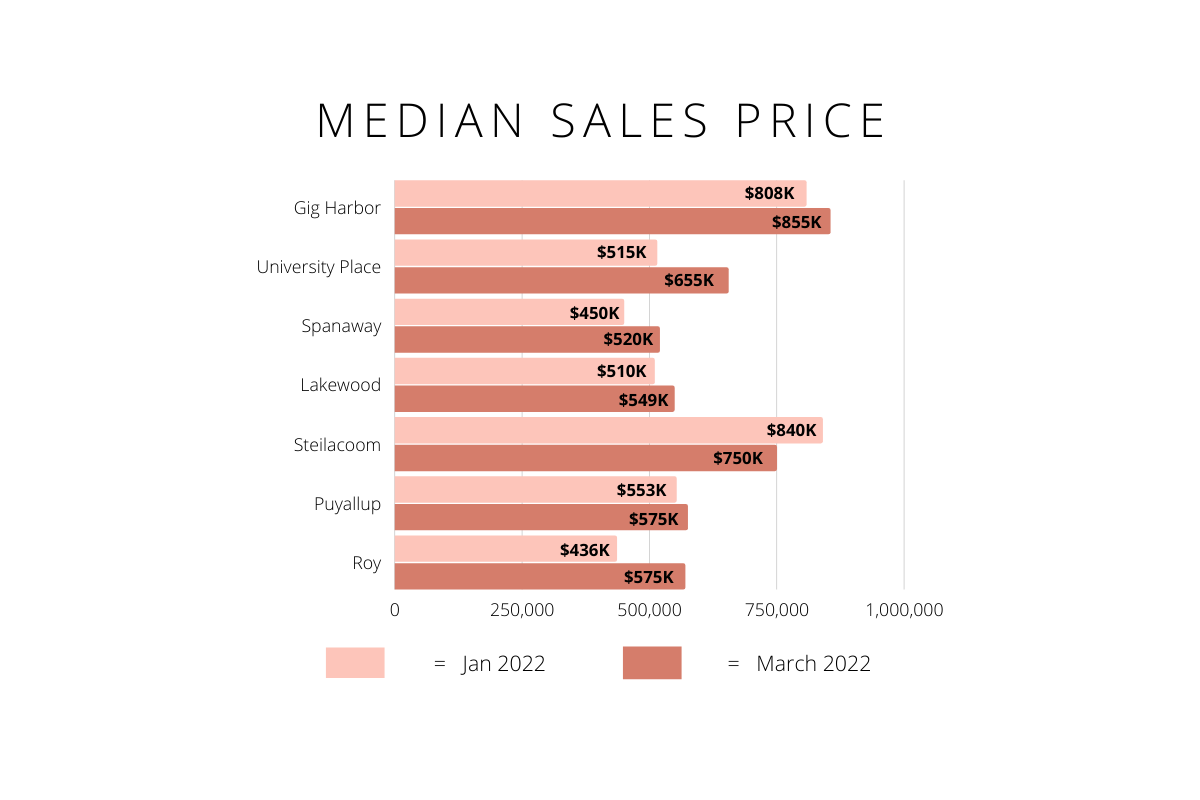
All but one city and neighborhood (Steilacoom) has increased in sales price. Steilacoom has a much smaller real estate market comparatively. Only five homes sold in January 2022 versus 11 in March 2022. South Tacoma and the Eastside of Tacoma are the only markets with median home prices below $500K. Gig Harbor continues to be the most expensive area overall followed by University Place.
Tacoma Residential Homes vs. Condominiums
We’ve compared single-family residential homes to condominiums in Tacoma. If you’re in the market to buy, you may consider expanding your search to include condos as well. There is double the amount of inventory (.8 months for condos vs. .4 months for residential homes). Another factor to consider, the average price of condos in Tacoma is up 31.7% year over year. Residential homes in Tacoma are up 17.1% on average.
Do you currently own a condo in Tacoma? Here is some great news: the average price of a condo in Tacoma is $468K. Five years ago, the average price was $217K. You likely have a TON of equity in your condo. This was the most intriguing aspect of the Market Update for Q1.