
The Market Update for Q3 2022 is here! Every quarter of the year we compile the data from the following counties: Pierce, Kitsap, Thurston & King. The data is pulled directly from the Northwest Multiple Listing Service. Curious about the stats for your specific neighborhood? Let us know, we are happy to run a market update report tailored just for you.
Our local real estate market is shifting- you’ve probably seen it on the news or heard it from a friend. What does this mean for you as a homebuyer or seller? We’ll break it down below for you. What’s the biggest difference in our real estate market from the beginning of the year until now? Interest rates. Interest rates have doubled since January this year. The average 30-year conventional loan interest rate is at 7% whichplaying a significant role in a homebuyer’s purchasing power.
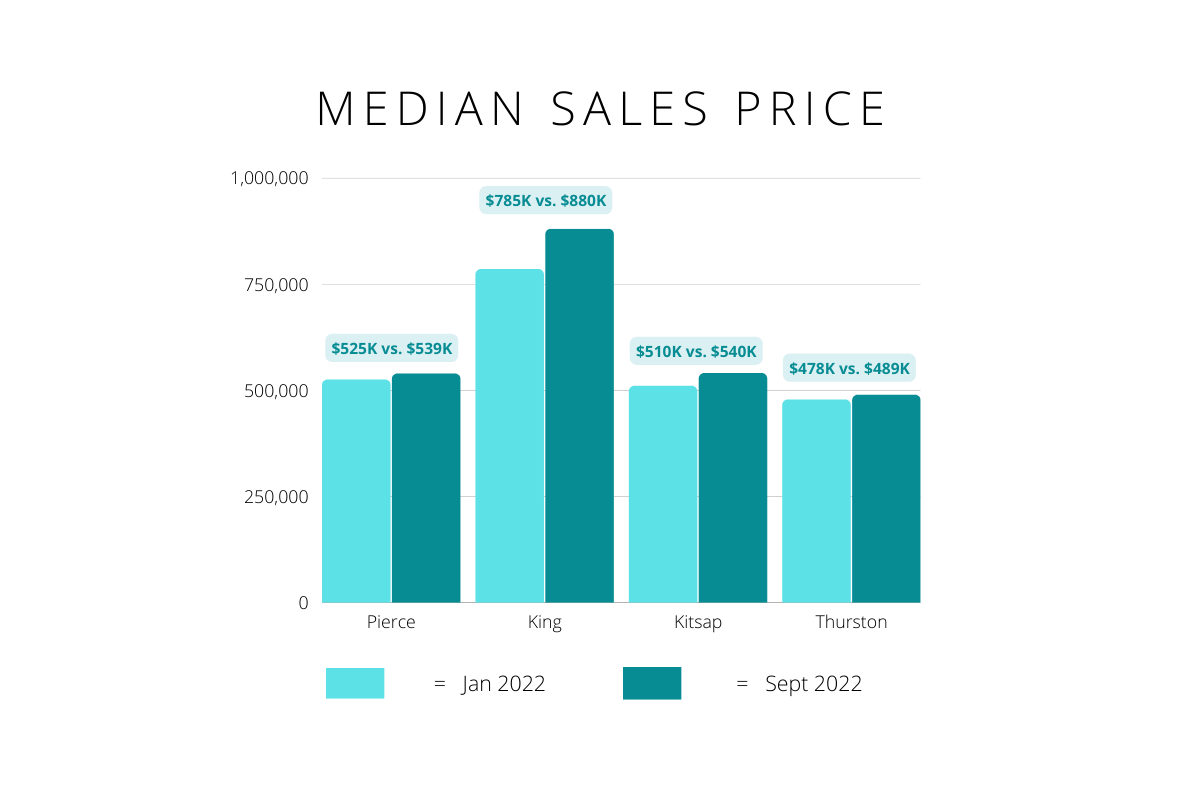
ARE HOMES PRICES DROPPING?
While home appreciation has increased this year, the appreciation has slowed dramatically. With higher interest rates (and therefore higher monthly payments for buyers) prices soaring well above the list price are not likely. Below you’ll find the median sales price for residential homes in Pierce, King, Kitsap and Thurston counties for January 2022 and September 2022.
ARE THERE MORE HOMES ON THE MARKET?
We’ve been tracking the inventory each month and despite what the media portrays, here in the Greater Tacoma region, we have less inventory on the market. However, the days the home stays “active” or available on the market has increased quite a bit. Let’s take a look at the number of new listings and amount of homes for sale on the market in Tacoma for 2021 and 2022.
In September 2021 there were 447 new listings (homes, condominiums and land). Now, in September 2022 there were 383 new listings. The speed at which homes are selling (days on market) has slowed, resulting in more options for buyers, less competitive terms for sellers and heavier negotiations on price and terms.
The number of days a home in Tacoma is on the market has increased by 14 days (two whole weeks!). In 2021, the average days on market was 6, compared to now, we up to to 20 days on the market.
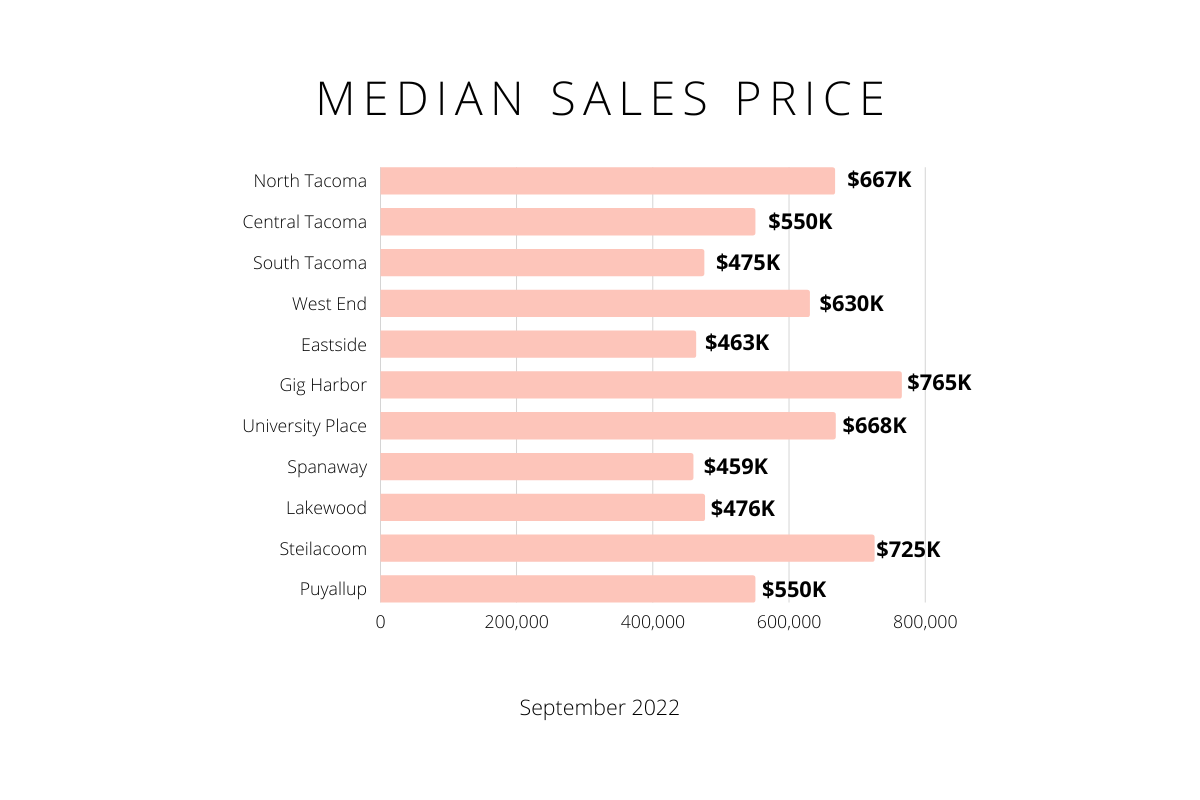
MEDIAN SALES PRICE BY CITY
Here are the median sales price by city to round out the Market Update Q3 report. How do these prices compare to the beginning of the year? Check out our Q1 market update here! Gig Harbor remains the least affordable area to live and Spanaway is the most affordable. Check out the other most affordable places to live in Pierce County. Curious how your home or neighborhood compares to our chart? We’re happy to send you a complimentary market analysis.
For a different perspective and breakdown on the current Real Estate States in Tacoma, head over to the Windermere Abode blog – Opportunities in the Tacoma Real Estate Market